![[object Object]](/lib_ubcXiSgTRmkLVyyT/k8w528b9mk1p20to.png?w=400)

Introduction
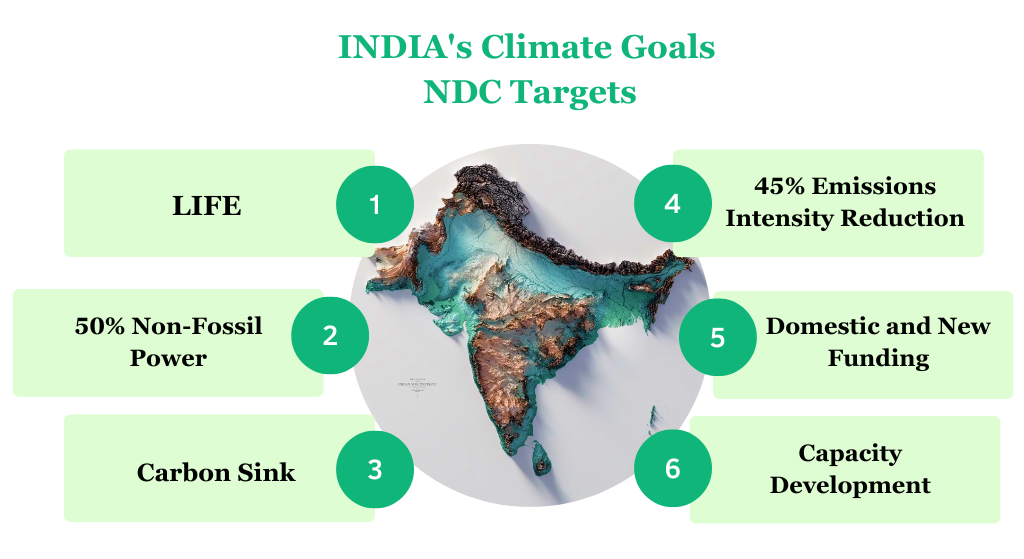
India has taken a leading role in addressing climate change by actively pursuing global climate targets through its ambitious Nationally Determined Contributions (NDC). In August 2022, India submitted an updated version of its NDC to the UNFCCC, highlighting the following key points:
- 'LIFE' - A mass movement emphasizing the importance of adopting an environmentally friendly lifestyle to combat climate change.
- Targeting a 45% reduction in the Emission Intensity of GDP by 2030, based on 2005 levels.
- Aiming for approximately 50% of the total installed electric power capacity to come from non-fossil fuel-based energy resources by 2030.
- Committing to a climate-friendly and cleaner development path, surpassing previous approaches taken by other countries at similar stages of economic development.
In a nutshell, India's climate objectives can be summarized as follows:
Source: Calculus Carbon Research
In order to support the achievement of the new NDC targets, the government has initiated the establishment of Indian Carbon Markets, creating avenues for new opportunities in mitigation.
India's Experience with Carbon and Environmental Markets
Voluntary Carbon Markets
Carbon credits in India have been generated through various project categories, including renewable energy, energy efficiency, industrial gases, fuel switching, municipal solid waste, and forestry. Notably, renewable energy credits have accounted for the majority, comprising approximately 85% of the total credits. This dominance can be attributed to the support provided by initiatives like the Clean Development Mechanism (CDM), which facilitated the early deployment of solar, wind, and hydro projects.
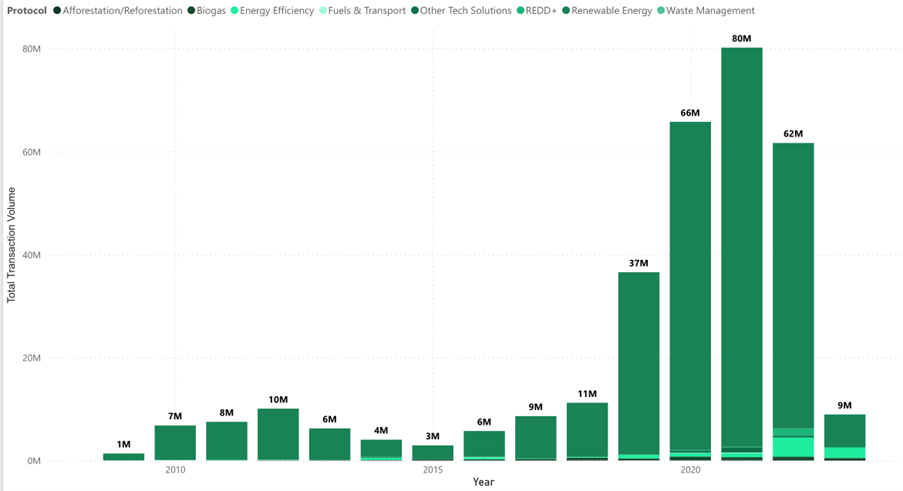
Figure 1: India's Issuance over the Years (Source- Calculus IQ)
Following the decline of the CDM market after 2012, when the European Union prioritized CERs from renewable energy generated in Least Developed Countries, the prices of CERs plummeted from a peak of $20 to less than $2 at present. With virtually no domestic demand for CERs, the market experienced a crash. However, India's extensive and diverse experience in mitigation activities has positioned the country at the forefront, ready to seize the opportunities offered by the national carbon market.
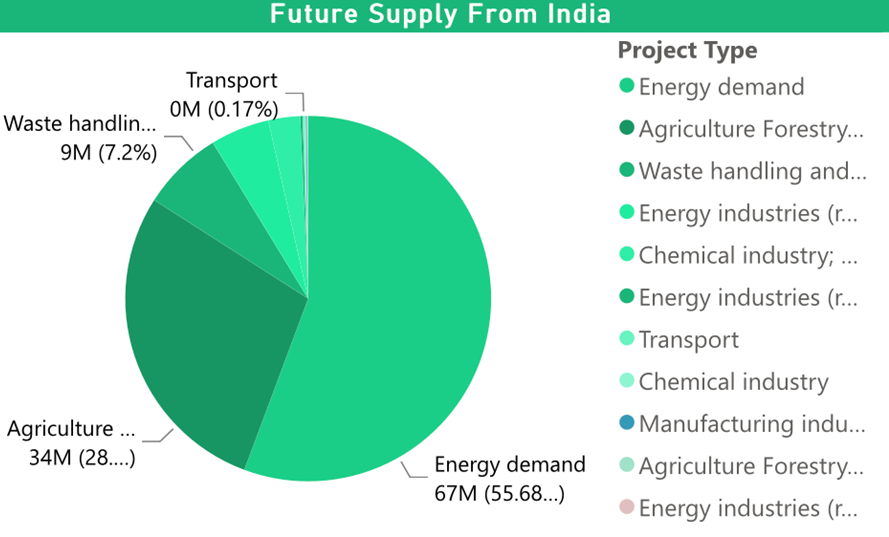
Figure 2: Future Supply from India w.r.t Project Type (Source - Calculus IQ)
In Figure 2, it can be observed that renewable energy credits are no longer eligible for accreditation. As a result, the majority of pipeline projects now consist of nature-based projects and energy efficiency initiatives, collectively accounting for over 80% of the projected future supply.
PAT Scheme
Perform, Achieve, and Trade (PAT) is a regulatory tool implemented to reduce Specific Energy Consumption in energy-intensive industries. It incorporates a market-based mechanism that enhances cost-effectiveness through the certification and trading of excess energy savings. PAT serves as a means to improve the energy efficiency of energy-intensive industries.
It was established under the National Mission for Enhanced Energy Efficiency (NMEEE) as part of the National Action Plan on Climate Change (NAPCC). The scheme aims to reduce specific energy consumption (SEC) in energy-intensive industries through targeted energy-saving measures.
Perform, Achieve, and Trade Cycle- I (2012-13 to 2014-15)
In the first cycle, 478 industrial units across eight sectors were designated as Designated Consumers (DCs). These sectors included Aluminum, Cement, Chlor-Alkali, fertilizers, Iron & Steel, Paper & Pulp, Thermal Power Plant, and Textile. Energy-saving targets were assigned to these DCs based on their current energy efficiency levels. The goal was to achieve a 4.05% reduction in total energy consumption, resulting in energy savings of 6.686 Million Tonnes of Oil Equivalent (MTOE). DCs that surpassed their SEC targets were eligible to receive Energy Savings Certificates (ESCerts) for their excess savings.
By the completion of PAT Cycle-I in March 2015, it was observed that the implementation had led to energy savings of 8.67 MTOE, equivalent to avoiding approximately 31 million tonnes of CO2 emissions.
Perform, Achieve, and Trade Cycle-II
For the second cycle of PAT, known as PAT Cycle-II, a "deepening" study identified 89 new DCs in existing sectors, while a "widening" study included three new sectors: Refineries, Railways, and DISCOMs. A total of 621 DCs from 11 energy-intensive sectors were assigned energy consumption targets. PAT Cycle II commenced on April 1, 2016, and concluded on March 31, 2019. The implementation of this cycle resulted in total energy savings of approximately 14.08 MTOE, equivalent to avoiding about 68 million tonnes of CO2 emissions.
Under PAT Cycle-II, the Ministry of Power issued around 57.38 lakh ESCerts to 349 DCs, while 193 DCs were directed to purchase 36.68 lakh ESCerts to meet their energy-saving targets.
Energy Savings Certificates (ESCerts)
ESCerts, short for Energy Savings Certificates, are tradable instruments issued under the Perform, Achieve, and Trade (PAT) mechanism. These certificates serve as a means of incentivizing energy efficiency improvements in industrial plants.
ESCerts are awarded to plants that surpass their energy-saving targets, acknowledging their overachievement. Conversely, plants that fail to meet their targets have the opportunity to procure ESCerts to compensate for their underperformance.
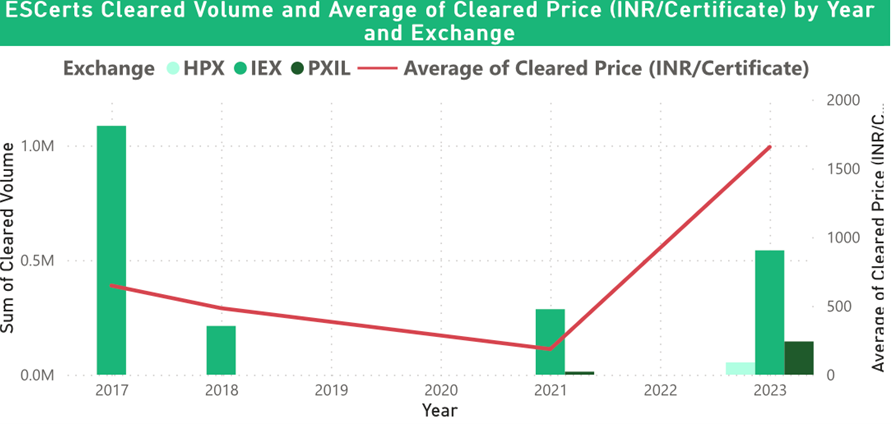
Figure 3 (Source - Calculus IQ)
Figure 3 demonstrates a notable trend in the ESCert market, indicating a decline in cleared volume over the years. However, in 2023, there has been a resurgence with a significant increase, surpassing half a million in cleared volume. During the period from 2017 to 2021, the average price exhibited a consistent downward trajectory. However, after 2021, there was a substantial three-fold increase compared to the levels observed in 2017.
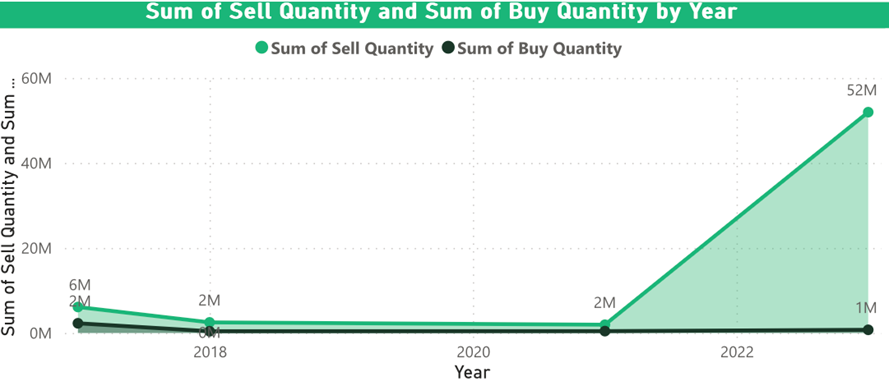
Figure 4: Comparision of Sell quantity and Buy quantity of ESCerts over the Years (Source - Calculus IQ)
Figure 4 illustrates a substantial disparity between the supply and demand of ESCerts, particularly after the year 2021. In 2021, the sell quantity was recorded at 2 million, while the buy quantity stood at 1 million. However, within a span of just two years, the supply quantity has significantly surged to 52 million, whereas the buy quantity remains unchanged at 1 million. This considerable gap between supply and demand highlights the substantial increase in available ESCerts, due to the non-stringent energy intensity targets.
Renewable Energy Certificates (RECs)
Renewable Energy Certificates (RECs) are a market-driven instrument that verifies the ownership of one megawatt-hour (MWh) of electricity generated from renewable energy sources. These certificates can be sold as a tradable commodity in the open market after the renewable energy has been fed into the grid by the power provider.
RECs offer the opportunity to sell earned certificates to other entities that produce emissions, enabling them to offset their carbon footprint. In this way, RECs serve as a valuable tool for promoting renewable energy generation and facilitating the trading of sustainable energy attributes.
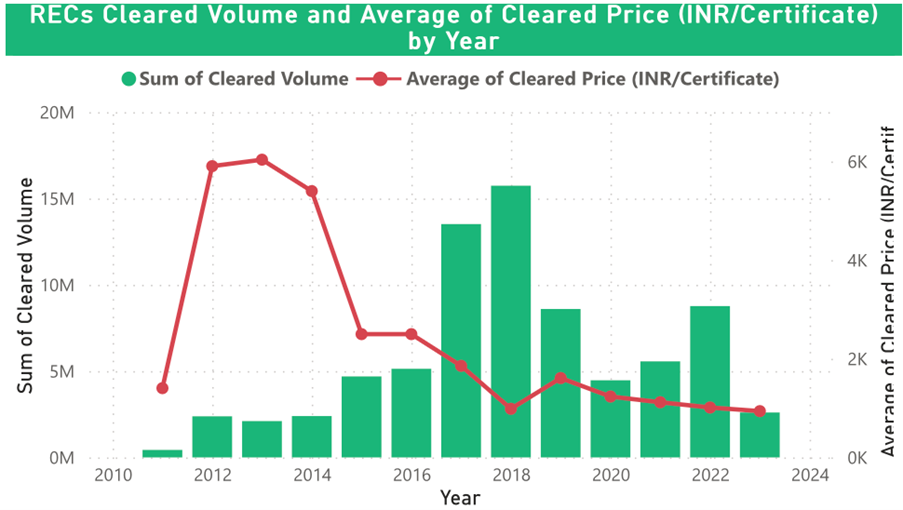
Figure 5 (Source - Calculus IQ)
Figure 5 exhibits a noteworthy pattern in the cleared volume of RECs over the years. From 2011 to 2018, the cleared volume demonstrated an upward trajectory, peaking in 2018. Subsequently, a decline was observed until 2021 when a resurgence began, with the cleared volume in 2022 matching that of 2019.
A correlation can be observed between the cleared volume and the average price of RECs. Initially, the price experienced a significant surge, with values around INR 1k in 2011 skyrocketing to approximately INR 6k in 2012. However, a decline commenced after 2013, reaching its lowest point in 2018, coinciding with the peak in cleared volume. Since 2018, the average price has maintained levels similar to those observed in 2011.
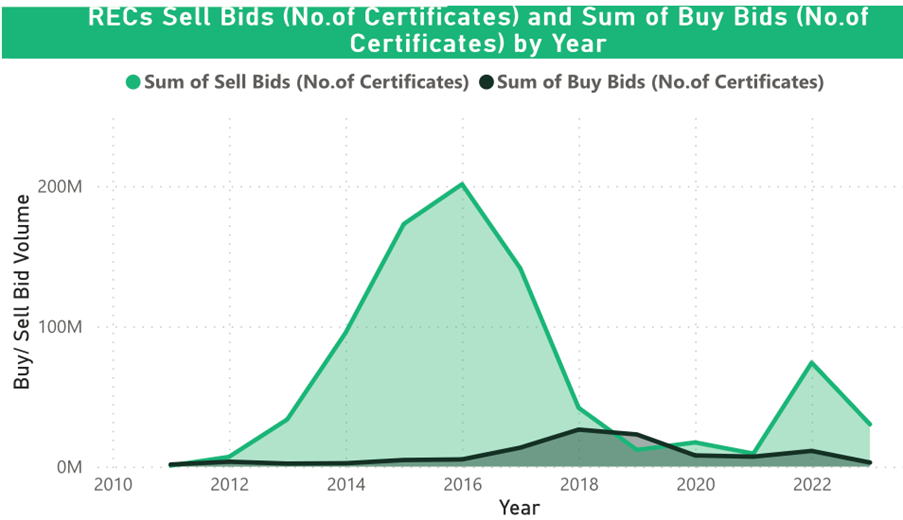
Figure 6 (Source - Calculus IQ)
Figure 6 provides insightful data on the trends of sell bids and buy bids in relation to the average price of RECs (shown in Figure 5). Notably, the total sell bids demonstrated a rising trend from 2012 to 2016. This can be attributed to the steep increase in the average price observed from 2012 to 2014. However, a significant decline in the average price during 2015 and 2016 contributed to the sell bids reaching their peak in 2016.
On the other hand, the buy bids reached their highest point in 2018, coinciding with the peak in cleared volume. It was in 2019 when the buy bids exceeded the sell bids, leading to an increase in the average price. This occurred after a period of consistent decrease in the average price since 2013.
Subsequently, both the buy bids and the average price have been on a declining trend after 2019. This observation suggests a correlation between the buy bids and the average price, with their patterns closely aligned over the given period.
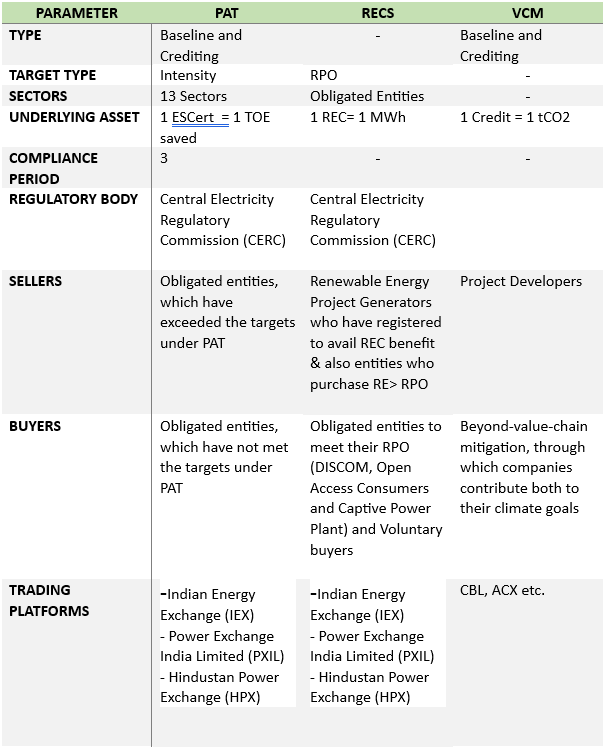
India’s Experience Summarized
Scope and Design of ICM
Under the Integrated Carbon Market (ICM), the obligated sectors currently involved in the Perform, Achieve, and Trade (PAT) and Renewable Energy Certificates (RECs) markets will continue to have obligations. Additionally, the ICM will encourage participation from other sectors that are not currently under the PAT or RECs schemes for the trading of offsets.
During the phase 1 transition, all existing and upcoming ESCerts and RECs will be eligible for conversion to Carbon Credit Certificates (CCCs). These CCCs will be available for voluntary purchases to absorb any excess or unsold certificates. Simultaneously, the development of the Offsets market will be encouraged, and projects undertaken by non-obligated sectors. These projects will be required to adhere to appropriate Measurement, Reporting, and Verification (MRV) processes, registration procedures, and approved methodologies, and demonstrate proven additionality factors.
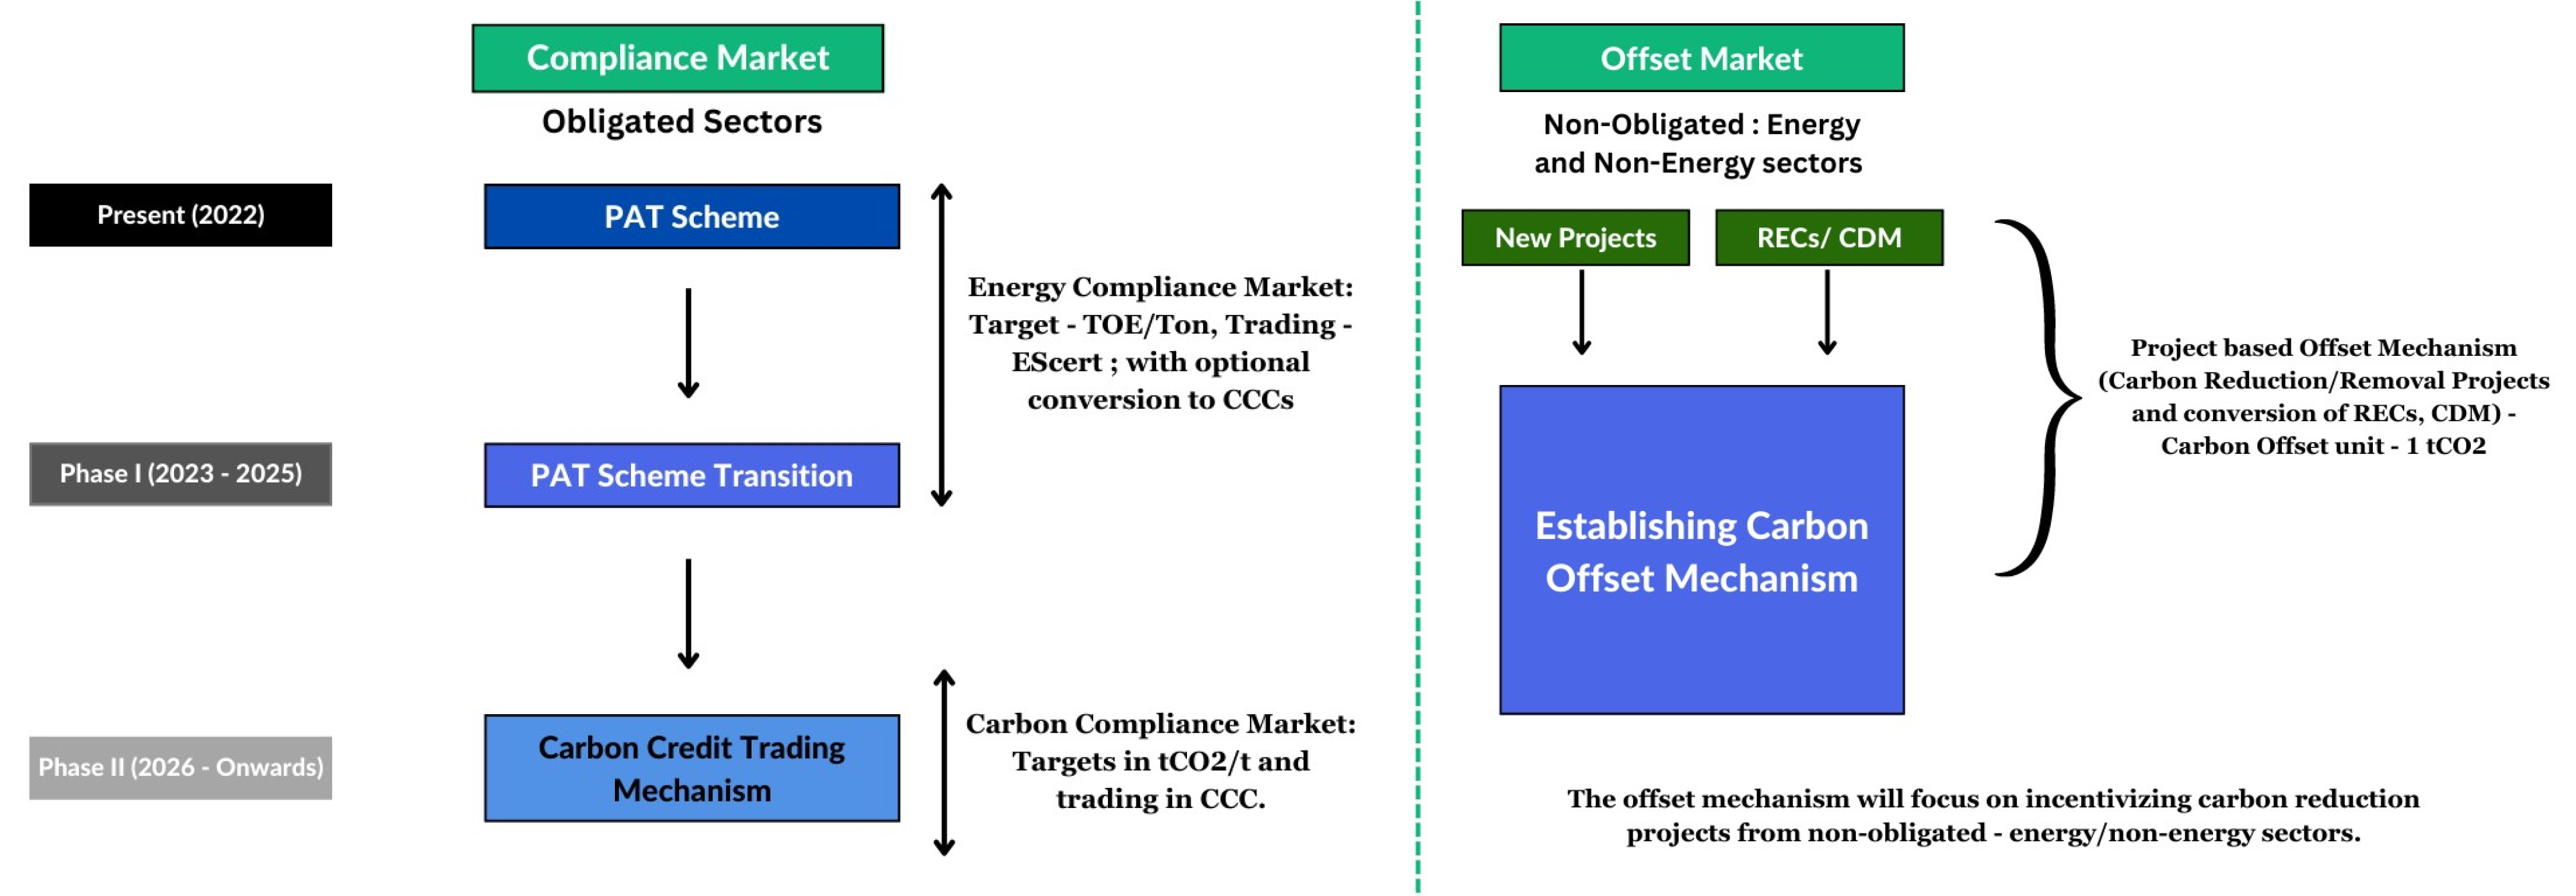
Figure 7 (Source - Calculus Carbon Research)
Phase II of the compliance market will bring about a significant transition from the existing energy efficiency compliance market to a carbon compliance market. During this phase, obligated entities will be assigned targets for reducing greenhouse gas (GHG) intensity. To fulfill their obligations, these entities will engage in trading mandatory carbon credit certificates (m-ccc).
Here are the key aspects pertaining to Phase II of the compliance market:
- Obligated entities will be required to enhance their energy efficiency and reduce GHG emissions per unit of output.
- Entities that emit below the target levels will receive credits, while those exceeding the targets will need to purchase credits.
- Target emission levels will be tailored to each sector or entity and may be adjusted to align with national targets.
- The proposed carbon credit trading scheme will follow an annual compliance cycle.
- Obligated entities will still meet their Renewable Purchase Obligations (RPO) through Renewable Energy Certificates (REC).
- Phase II aims to encompass both energy and process emissions in the GHG emissions coverage for obligated entities.
- Annual targets will be measured in metric tons of CO2 per metric ton of output for all obligated entities under The Environment Protection Act, 1986.
- Carbon Credit Certificates (CCC) will be issued and traded among obligated entities (PAT).
- Obligated entities and voluntary buyers will have the option to purchase offset carbon credit certificates (O-CCC) up to a defined percentage of their total obligation. These credits can also be exported to the international market after meeting specific criteria.
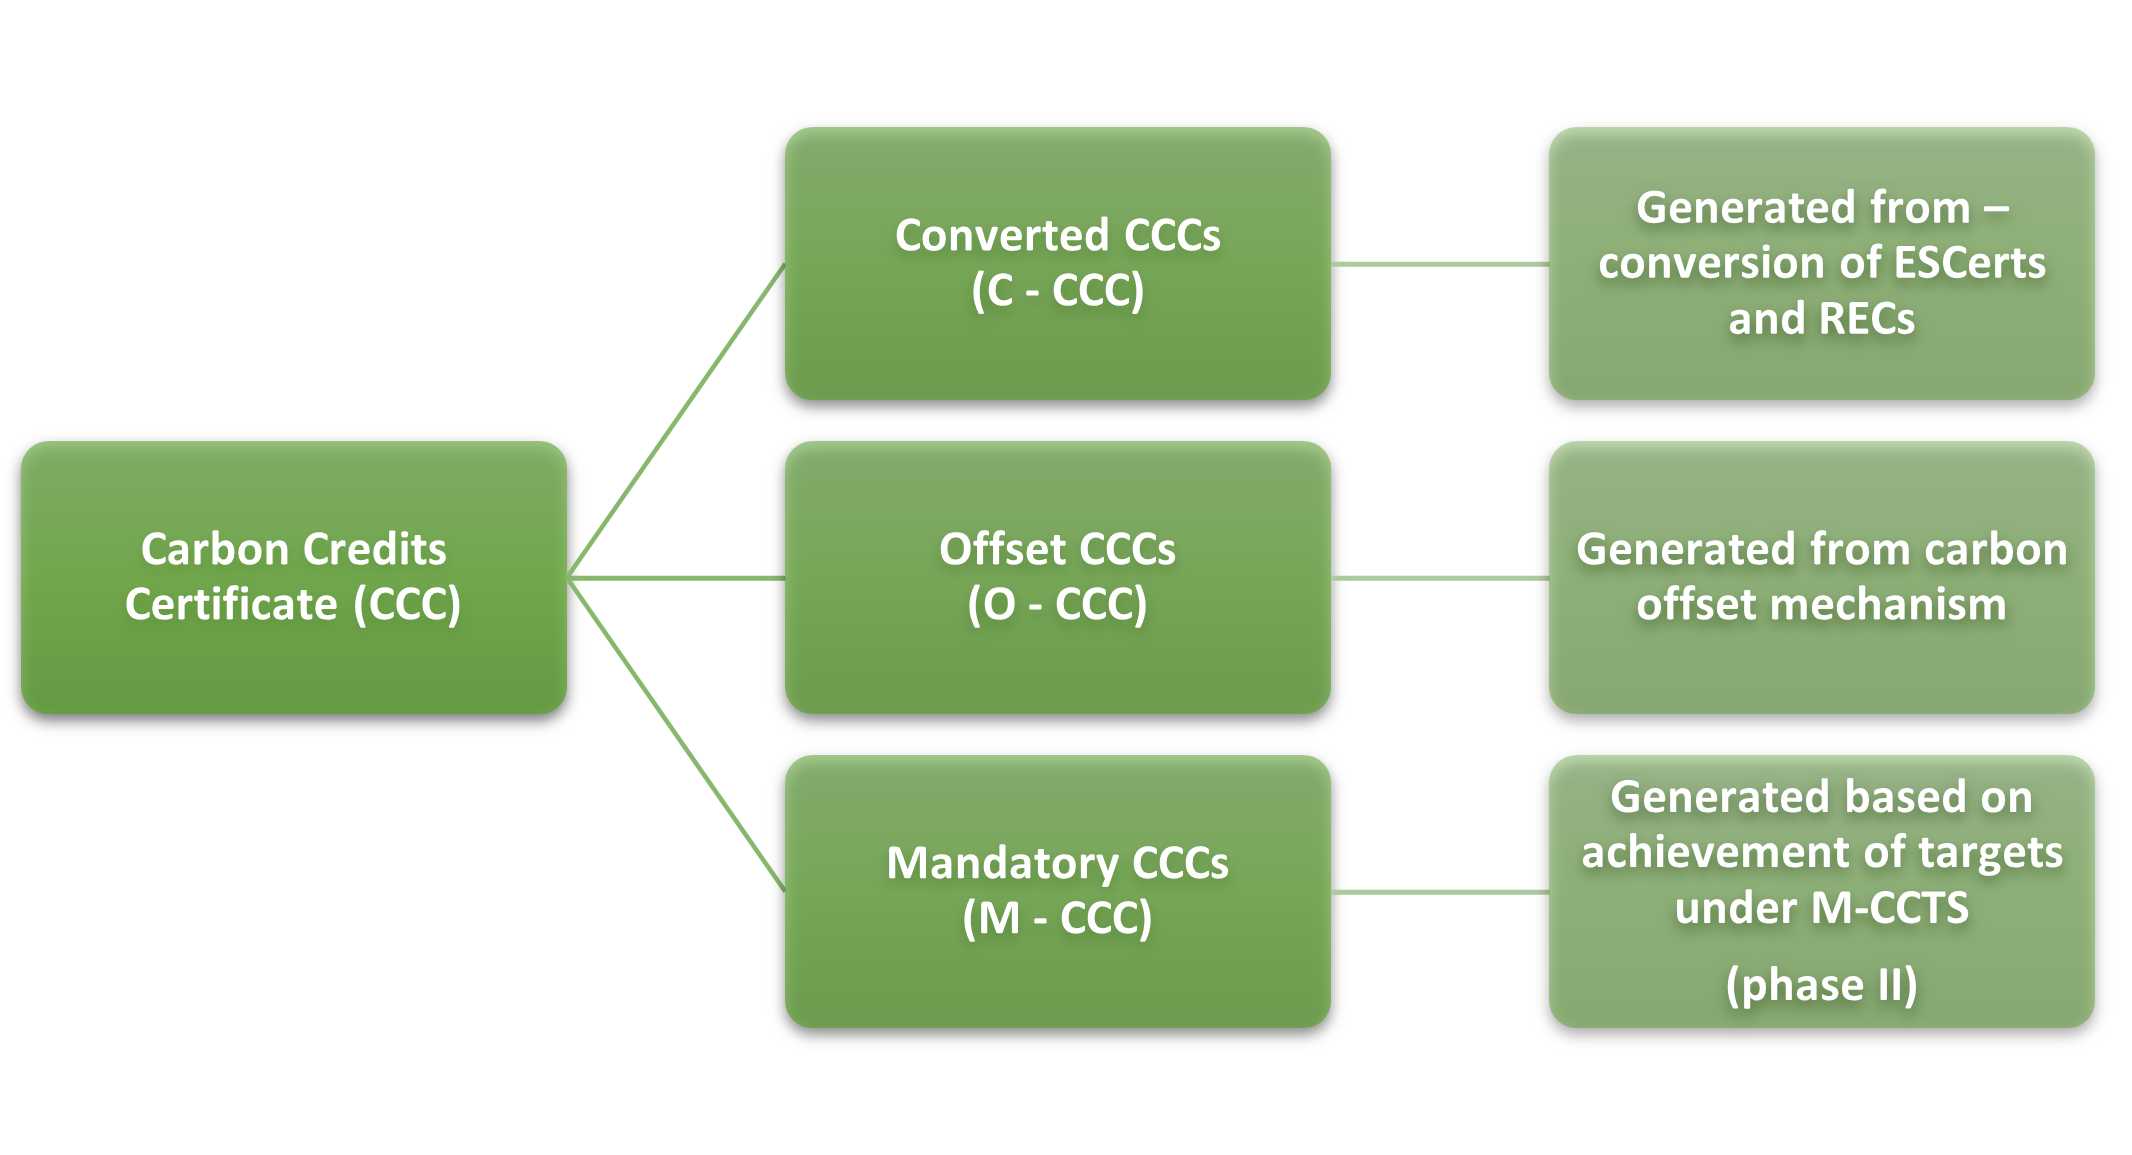
Figure 8: Types of Certificate under ICM (Trading /unit = 1 tCO2e) (Source - Calculus IQ)
Conclusion
India has demonstrated its commitment to addressing climate change through its Nationally Determined Contributions (NDC) and the establishment of carbon markets. The country's experience with carbon and environmental markets, particularly through initiatives like the Perform, Achieve, and Trade (PAT) scheme, has resulted in significant energy savings and emissions reductions. The market dynamics of Energy Savings Certificates (ESCerts) and Renewable Energy Certificates (RECs) have shown both challenges and opportunities for further development.
As India moves into Phase II of the compliance market, the integration of obligated sectors and the participation of non-obligated sectors in the trading of offsets will play a crucial role. The proposed carbon credit trading scheme, with its focus on energy efficiency and process emissions, aims to align with national targets and promote sustainable development.
The establishment of the Integrated Carbon Market (ICM) and the conversion of ESCerts and RECs to Carbon Credit Certificates (CCCs) will provide new avenues for voluntary purchases and the absorption of excess certificates. Additionally, the development of the Offsets market and the adherence to robust MRV processes and methodologies will contribute to the overall effectiveness of the carbon market.
India's efforts in transitioning towards a carbon compliance market demonstrate its dedication to achieving climate targets and contributing to global climate action. By leveraging the opportunities presented by the carbon market, India can continue to drive energy efficiency, reduce emissions, and foster sustainable growth in the years to come.
If you are interested in learning more about the voluntary carbon market, we invite you to interact with Calculus IQ. This tool can help you explore different aspects of the market, including project types, retirement volumes, and more.